Introduction to the Smith Chart - Part 2
Introduction
In the article, "Introduction to the Smith Chart - Part 1", we covered the version of the Smith Chart that showed total impedance when the components are connected in series.
As the component resistances R and reactances X can simply be added to find the total impedance Z when they are connected in series, this version of the Smith Chart is commonly introduced to prospective RF engineers and students as a first exercise. We will soon discover that for components that are wired in parallel, we cannot just add component resistances and reactances to get the total impedance.

In series, resistances R and reactances X can be added. What about the parallel configuration?
Admittance (Y)
There is a method to analyse components that are in parallel. First we take the reciprocal of impedance as follows:
$$Z = R + jX $$
$$Y = \frac{1}{Z} = \frac{1}{R + jX} = G + jB $$
We can see that the equation produces a new expression where resistance R is replaced with conductance G and reactance X is replaced with susceptance B which both compute a new quantity called admittance Y.
The conductance G, susceptance B and admittance Y are expressed in siemens or "S".
The individual elements that make up admittance can be calculated as follows.
Calculating conductance G
The conductance is just the reciprocal of resistance.
$$ G = \frac{1}{R} $$
Calculating magnitude of susceptance B
The susceptance is the reciprocal of reactance which depend on signal frequency in Hertz (Hz) and the inductor/capacitor values, L and C in Henries and Farads respectively.
Inductor susceptance written as BL
$$B_{L} = \frac{1}{X_L} = \frac{1}{2\pi f L}$$
Capacitor susceptance written as BC
$$B_{C} = \frac{1}{X_C}=2\pi f C$$
Similar to reactance, susceptance can be negative or positive when expressed using the j operator.
Analysing parallel circuits
So why use admittances, conductances and susceptances?
Because expressing the components as the above quantities when they are connected in parallel enables us to add the quantities much like when the components were wired in series. Notice how the susceptance reverses the sign on the inductor and capacitor reactances.
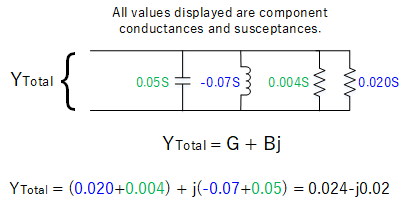
Adding conductance and susceptance
The admittance Smith Chart (Y chart)
Normalisation
We mentioned normalisation in the previous article as a necessary first step when plotting a value. Since our measurements can involve very small or very large values, normalisation is necessary in order to fit our data onto the chart. For impedance Z, we divide by a known reference. By convention, the characteristic impedance Zo is used.
$$Z' = \frac{Z}{Zo}=\frac{R+jX}{Zo}$$
For admittance, it is the same proceedure. However, we divide by the characteristic admittance Yo which is the reciprocal of Zo, i.e. 1 / Zo.
$$Y' = \frac{Y}{Yo}=\frac{G+jB}{Yo} = (G+jB)Zo$$
If Zo was 50 ohms then our previous example of Y = 0.024 - j0.02 would output Y' = 1.2 -j1.0 after normalisation.
Using the admittance Smith Chart (Y chart)
The admittance Smith Chart (Y chart) has the same basic structure as the impedance Smith Chart (Z chart) with circles and lines. Instead of component resistance (R) and reactance (X), the Y chart displays conductance (G) and susceptance (B).
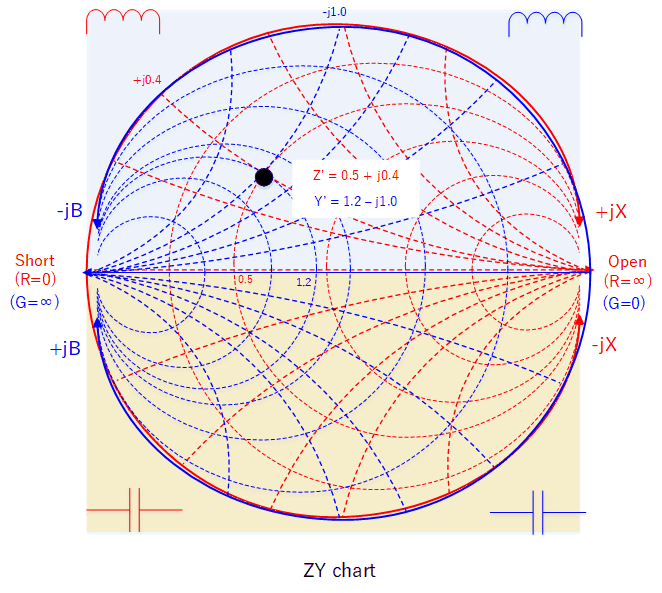
Referring back to our example, Y' = 1.2 - j1.0 is plotted below. Reflecting this point to the Z chart allows us to find the corresponding impedance, which in this example gives us Z' = 0.5 +j0.4.
Un-normalising this will give Z = 25 + j20.
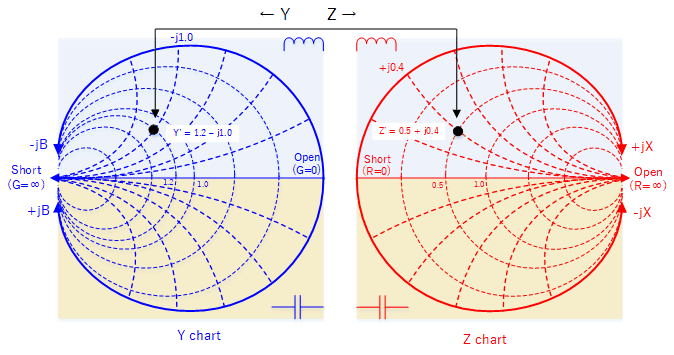
And we can do this without having to do the calculation manually!
So we note that when using the Y chart:
- If the circuit has pure resistance (no susceptance), Y will lie on the horizontal axis.
- Inductors L introduce negative susceptance and shifts Y upwards.
- Capacitors C introduce positive susceptance and shifts Y downwards.
The combined Smith chart (ZY chart)
We now have 2 charts that can graphically show impedance and admittance values. Since the position in the chart is the same for both, it is possible to overlay both charts and produce the ZY chart. In this way, a single point will indicate both Z and Y allowing us to easily swap between the two.
 Example
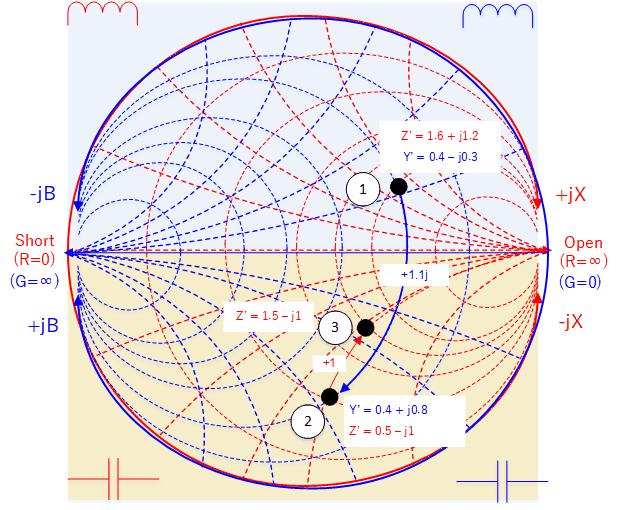
We will see how we can use the ZY chart to analyse a circuit with mixture of series and parallel components. Let's say we want to discover the total impedance ZTotal for a circuit frequency of 400 MHz.
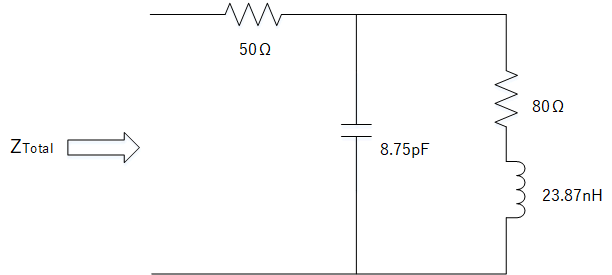
Work out ZTotal
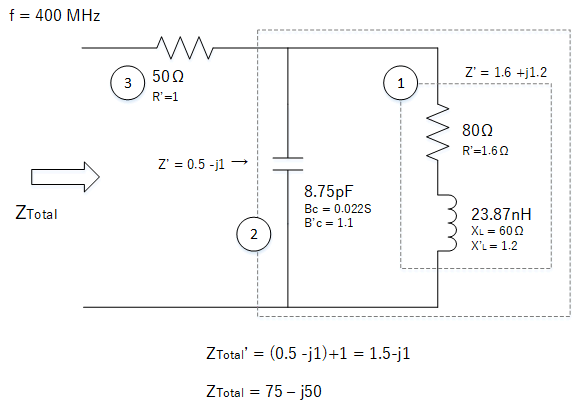
First we note which components are in series and which are in parallel. This tells us whether if we need to use the resistance/reactance or conductance/susceptance. By starting from the end components and working back, we can proceed logically as follows:
- First work out the combined impedance of the series resistor and inductor. We can use resistance and reactance since they are in series.
- Then merge with the capacitor as a parallel configuration using the capacitor susceptance.
- To this, add the final resistor in series.
The points above can be referred to in the below diagrams.
 Reading VSWR from the chart
Besides circuit analysis, the Smith Chart is able to provide other useful measurements - one of which is VSWR.
The VSWR (see previous article - Impedance and Standing wave ratio) indicates how much of the transmitter output power is absorbed by the antenna. Any power not absorbed by the antenna is reflected and combines with the forward waves to create standing waves in the cable.
Consider a transmitter connected to a cable with characteristic impedance Zo = 50 ohms. A load (such as an antenna) with impedance Z = 50 + j0 will present a VSWR of 1 to the transmitter when connected.
If the load impedance is changed so it is no longer 50 + j0, we can draw a circle at the centre of the chart that intersects this impedance. The VSWR will be constant for all impedances lying on this circle and proportional to the radius L of this circle. To obtain the VSWR from L, the chart will include a VSWR scale at the bottom to allow the user to read off the VSWR.
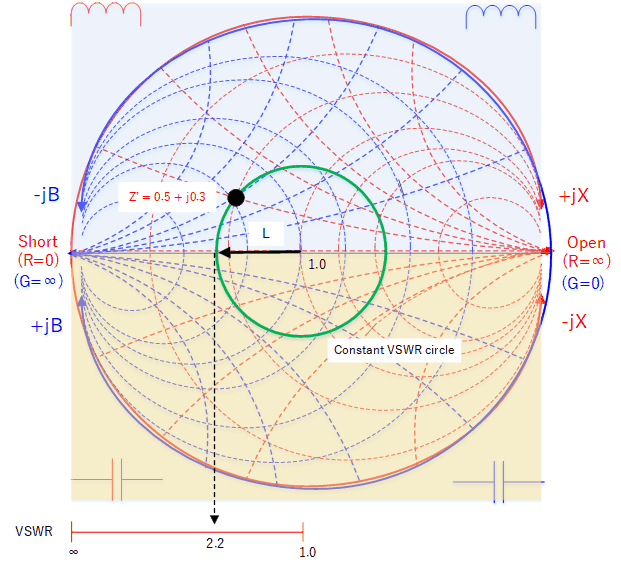
Circle of constant VSWR from the centre point. Every load impedance on this circle will present the same VSWR of 2.2.
It would therefore be the job of the engineer to use the chart to design some sort of matching network so that the final impedance becomes close to as much as possible, 50 + j0.
Conclusion
Hopefully this article as well as part 1 has provided some insight about the versatility of the Smith Chart. There are many other useful measurements that can be derived from the chart which is beyond the scope of both articles.
However what is emphasised here is the immediate use of such a chart when looking at the performance of RF systems rather than detailing its origin (which can make the topic unapproachable to many non-RF engineers).
 Example
 Reading VSWR from the chart