Signal to Noise ratio
Introduction
When communicating using radio, it is important to understand how to measure signal and noise levels to determine the communication environment and reliability. After reading this article, engineers should have a good understanding of these terms and how to use them while designing their radio system.
Received signal level
Known as RSSI (Received Signal Strength Indicator) or simply RSS, this value represents the signal strength at the receiving antenna. Mostly this is recognised by having, for example, a graphical "bar" type display with the number of bars indicating the RSSI value as shown below. Or the value maybe displayed as a percentage. It is possible to display RSSI value as an absolute value, e.g. -90 dBm. In any case the higher the value, the stronger the signal.

Received signal strength using bars
Noise level
Definition
First what do we mean by noise? Noise is any undesired signal in the receiver (either internally or from the environment) that interferes with the signal that we are trying to receive. For example, when listening to a compact cassette tape, we can often hear a high frequency hiss in the background. This is known as tape noise and exists naturally due to the random arrangement of magnetic particles in the tape. Similarly, noise can be present during reception of an RF signal, that can make data recovery difficult or prone to errors.
Sources of noise
Natural sources of noise include lightning (heard as crackles on AM radios), cosmic radiation from space etc. Other sources of noise are manmade such as car ignition, light switches, computer monitors, fluorescent tube lights, inverters, power lines etc. There may also be other wireless devices in the area producing signals at similar frequencies.
Noise can even be generated from the receiver's inbuilt components such as an LCD etc. where unintentional radiation from such components is an ongoing problem. Also all components output noise due to the thermal agitation of charge carriers and become worse with increasing temperature. Hence, receivers such as radio telescopes rely on cryogenic cooling to maximise their sensitivity.
Signal to Noise ratio (S/N)
So to improve signal reception with the minimum chance of data errors, we need to maximise the signal we want (desired) while at the same time we want to minimise any signal we don't want (the undesired). The ratio of the desired to the undesired level is the D/U ratio. Or rather it is the amount of signal margin available known as the signal to noise ratio, S/N or SNR.
Distinction between receive sensitivity and S/N
In the specification for radio receivers, one of the parameters is receiver sensitivity. This is defined as the lowest signal level (in dBm) where reception is still possible. The lower this value is, the better the sensitivity. But does this mean that radio waves are able to travel further?
You would expect that higher sensitivity = longer distance. However it is not the whole story.
Receiver sensitivity is measured by the manufacturer and involves connecting a signal directly to the receiver antenna terminal. This means the receiver performance is judged with little signal interference from the environment.
In practical communications however, the antenna will pick up unwanted signals from the environment as well as the wanted signal, so communication performance must be evaluated by looking at the both the wanted (desired) signal level and the noise (undesired) level. This is the signal to noise ratio (or D/U) we described above and the measurement that must be used.
For example Circuit Design's MU-2 module can receive at a level of -100 dBm, but reception is still possible with a noise floor level of -120 dBm (giving a S/N of 20 dB). In the second example, the signal level is higher at -80 dBm, however the noise floor is also higher giving only 5 dB S/N and reception is not possible.
S/N of 20 dB
S/N of 5 dB
Measuring RSSI
What about RSSI? The RSSI as explained above is the receive level seen at the antenna and almost all Circuit Design modules have a method of outputting the realtime RSSI value, either by issuing the command or using the module's RSSI terminal. (Please refer to the operation guide of the product for details).
Note the RSSI value is not an indication of the S/N and only shows the overall level. Determining the S/N from the RSSI is as follows:
- Measurement of RSSI while receiving signal
- Measurement of RSSI with no signal (noise floor)
The margin between these 2 levels will give the S/N.
Determining the S/N from the RSSI values
Results seen from actual measurements
The below results were obtained with Circuit Design's MU-2 429 MHz module. Note that you can also expect similar performance when using the MU-4 434 MHz module.
Noise floor level
The command, @CA allows a source station to request the RSSI level of every channel at a target station. For the MU-2 429 MHz there are 40ch (ch7 - 46). The user can obtain the noise floor at the target station. In this test, the command was repeated every 30s for a total of 50 minutes (allowing the RSSI data to be collected 100 times). The readings are displayed below.
RSSI data collected 100 times
As you can see the noise floor is not constant but fluctuates. If we compare just the 100th set of the RSSI with the maximum/minimum level and plot them together, we get the graph below:
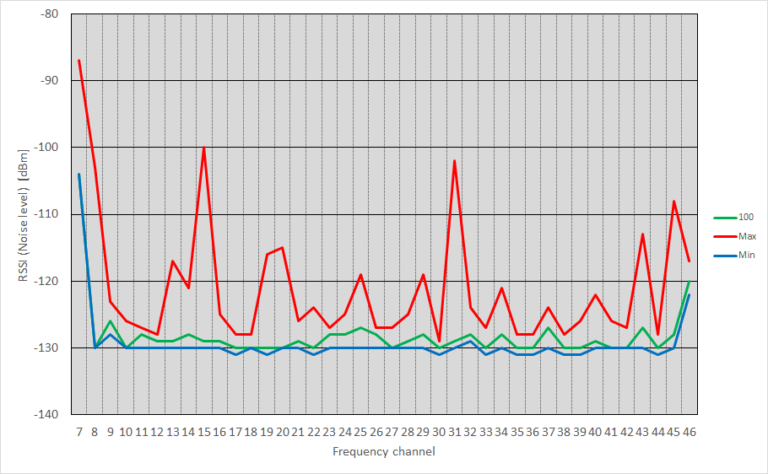
RSSI of all channels
(100th set, minimum and maximum)
When the RSSI is viewed over a long period of time, you can see how the noise floor can change by 6 and 8 dB. What can also be seen when looking at many RSSI readings over a long time, are signals on other channels. Such as channels 15, 31, 43 and 45.
Looking at the S/N
The command, @CR allows RSSI of both signal level and noise floor level around the target station to be obtained. The result contains 2 readings - one for the signal level and one for the noise level. The command is repeated every 30s for a total of 50 minutes and plotted against time.
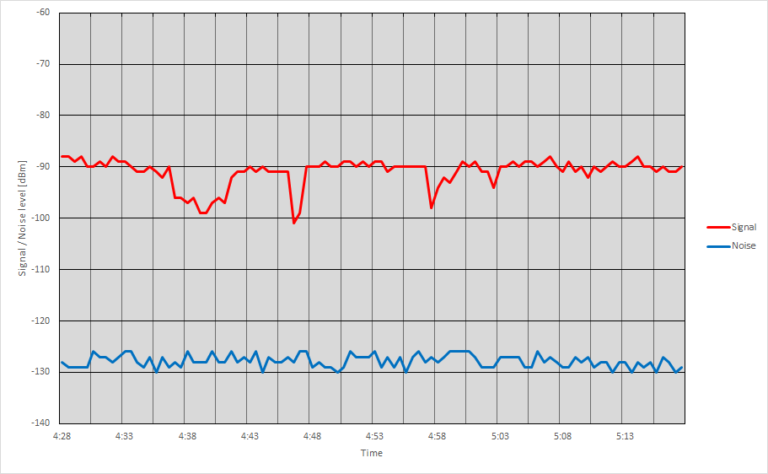
RSSI of signal and noise floor vs time
You can see that the signal level is not constant but falls by 10 dB and more in some places. This is likely due to the movement of people, objects etc. in the area affecting radio propagation. In the field where there are cars and people, it is possible for the level to change even more.
Conclusion
As the MU-2 uses binary FSK (2-FSK), it is necessary to leave at least 10 dB in your S/N for reception. In the test above, we saw that the signal level fluctuated by 10 dB or more over a 50 minute duration. Therefore, for reliable communication, it is recommended to add extra margin to bring the S/N to about 20 dB to 30 dB.
For radio waves to travel long distance, we need to consider not only receiver sensitivity, but also noise level.