Performing field tests
Introduction
When installing a wireless link, one of the concerns the user has is mainly along the lines of, "will the radio waves reach my receiver?". Since radio waves are a physical phenomenon, it is not an easy question to answer.
The article "Confirming radio conditions in advance", looked at the merits of using radio simulation. In this article, we focus on field testing - testing the communication link in the actual environment.
Are simulation tools enough?

Are simulation tools enough?
Simulation tools are computer simulations showing how radio waves propagate under various conditions. Users input parameters such as transmitter output power, distance, antenna gain and heights and so on. The output for example, maybe, what level will the receiver see at a certain distance from the transmitter.
With simulation tools, it is not too difficult to model radio waves in simple environments such as free space. However in reality, environments are not simple. They contain foliage, obstructions that can reflect, attenuate or block radio waves. Sometimes obstructions can prevent a direct line of sight which may or may not impact performance.
Also what happens if radio waves have to be received indoors?
Using a real radio
Once a certain progress is achieved through simulation, the next step is to verify the results through field testing.
A field test is an opportunity to demonstrate if communication performs in your chosen environment. You will be working with real quantities that can be measured. You can send data, perform packet tests and determine the best placement for your transmitter and receiver.
Challenges with field testing
The field test requires use of an actual radio module to physically transmit and receive the radio waves to create a functioning communication link. A radio module only performs modulation and demodulation so we require a source of data. An option is to use evaluation kits with pre-formatted data to operate wirelessly e.g. buttons and LEDs.
However in order to replicate the actual conditions of the real communication link, you should use your actual data for transmission and reception.
Additionally during the simulation, you probably assumed that the transmission power can be emitted freely. However during testing you have to follow the rules and regulations (e.g. the power and duty cycle limits) of the particular frequencies you are using that will also apply to your proposed communication link.
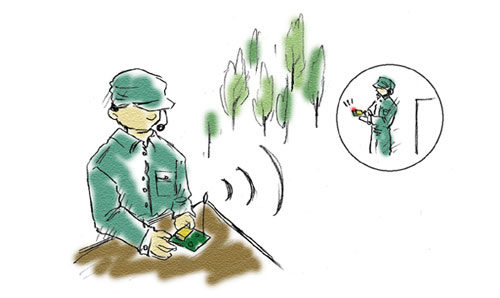
What tests do I need to perform?
Setting up
Below shows an example setup for a communication test.
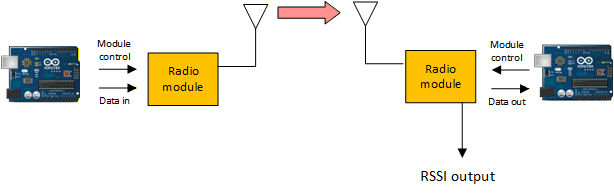
Setup for communication test
Sending and receiving data is needed, as well as a means to control the radio module. This can be done, for example by an Arduino or similar. The radio module accepts data into its input terminal and transmits it on the desired frequency channel. Another radio module receives and outputs the data from its output terminal.
Received signal strength indicator (RSSI)
The received signal strength indicator shows the instantaneous reception level for that frequency channel. RSSI is always indicated whether data is being received or not. So you can see the changes in RSSI during data transmission.
RSSI terminal
If the radio contains such circuitry, it can measure the received signal level and represent this as an analogue voltage. For example, the module may have a terminal where this voltage can be output in real time.
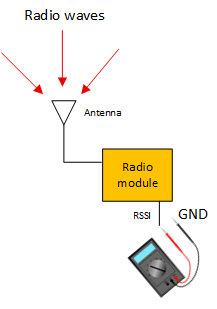
The RSSI terminal
Converting relative values to absolute values
The RSSI represents the electric field strength at the receiver's location. Through the antenna gain and the receiver input impedance (i.e. 50 ohms), this can be converted to absolute voltage (e.g. uV or dBuV) or absolute power (e.g. dBm) present at the receiver input terminal.
If the module outputs an analogue voltage from the RSSI terminal, the radio manufacturer specifies a calibration table to convert the voltage to dBm.
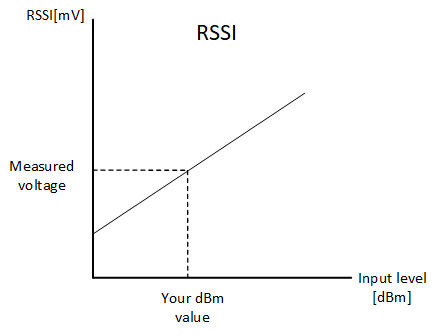
Reading off RSSI as dBm
It maybe possible to interface the RSSI output to an analogue input on the CPU or Arduino and incorporate it as part of the test program allowing you to further automate tests.
Packet testing
By formulating data into packets and transmitting them individually to a receiver, we can count the packets that get transmitted. By comparing how many packets were transmitted and how many were successfully received, we can determine the reliability of our communication link.
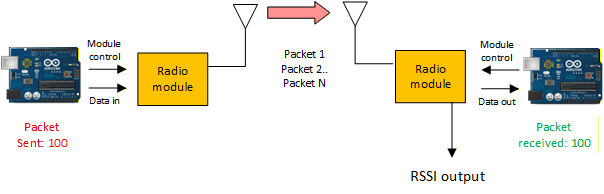
Packet test
Interpreting test results
Signal to Noise ratio
By noting your RSSI reading at the receiver during a) when receiving your signal and b) when not receiving your signal i.e. just noise, the signal to noise ratio (SNR) can be calculated as a unitless ratio:
Signal to noise ratio = RSSI when receiving signal / RSSI of only noise
If your RSSI levels are in absolute decibel units (e.g. dBm) instead of watts, you can use ordinary subtraction and addition to express ratios:
Signal to noise ratio [dB] = RSSI when receiving signal [dBm] - RSSI of only noise [dBm]
How much SNR do you need?
For a communication link to work, it needs a minimum amount of signal to noise ratio to be reliable. For example, you can correlate your packet test results with SNR to determine how much you might need. For more information on signal to noise ratio, see the article, "Signal to Noise ratio"
Packet success rate
If you are sending and receiving packets, you can check how many the receiver managed to demodulate and output. For example, if you sent out 100 packets and received only 80, that is a success rate of 80%.
What success rate is needed? You have to expect that even if you are able to achieve 100% success rate with 100 packets, that may not be consistent across 500 or 1000 packets, for example. A 100% success rate all of the time is unrealistic meaning a test less than a 100% does not necessarily mean rejecting your communication link.
For example, you want to send a single packet reading from a sensor. If you send this only once, obviously you would need a 100% success rate because you have not incorporated any form of redundancy.
So now you assume that any radio communication will output less than 100% success rate. So you can go further and send the same packet 100 times and the required success rate drops to 1%. For one packet, this is excessive and will use unnecessary transmission overheads (e.g. transmission time, battery usage), so instead you decide to send it 10 times requiring the success rate to be at least 10%.
However these success rates are only expected values. Statistically, sending 10 times for a 10% success rate, we can expect an average of one successful reception. However this also covers cases with zero reception, so there is no guarantee.
Example: Sending one packet takes 60ms, transmitting 100 times will require 6s. Reducing it to 10 times will require 600ms or just under 1s which is more practical. Can you imagine the implications if you had a communication link for polling several receivers in your system?
Noise floor
When looking at the RSSI before receiving a signal, you are measuring just the noise on that channel. There will always be a certain amount of noise, whether that is from other devices transmitting on the same channel or generated by the receiver itself. If you sample the RSSI on other channels, you can establish a base level of noise from which to measure your received signal during transmission.
Since the noise floor can fluctuate over time, you may see different results if you repeat the test. Therefore you can establish the amount of variation in the noise level throughout the day.
Presenting test results
Band activity
RSSI values can be plotted against channel. For example, the amount of band activity and the noise floor can be seen. You can also visualise the amount of noise variation.
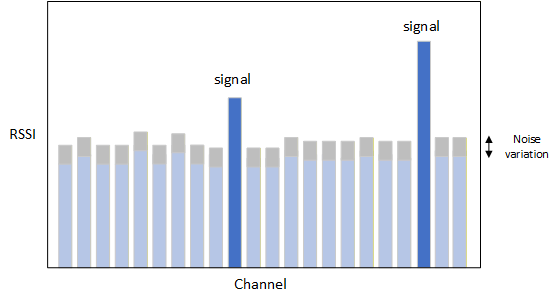
Seeing the band activity
Presenting signal to noise ratio visually
Looking at the RSSI vs time shows the level on a single channel. Under test conditions, the time domain allows you to see the signal to noise ratio for that channel at the receiver when a) the transmitter is OFF and b) the transmitter is ON.
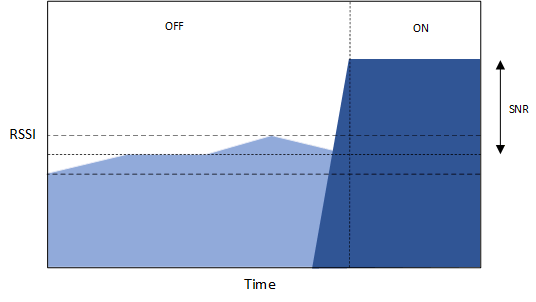
Visualising signal to noise ratio
Plotting results on a map
It is possible to collect measurements in conjunction with GPS to connect them with location. Once the measurements have been collected, values (such as signal level and noise level) can be marked on a 2D map of the area.
Conclusion
Will my communication link work?
So after collecting all these results, you need to make a judgement on your proposed communication link.
You were able to perform SNR tests and correlate this with the packet success rate. You also looked at the amount of general variation in the noise throughout the day.
- Determine what is the required packet success rate. If you take the previous example of 10% packet success rate, you can attempt to match this with required SNR.
- Next you need to determine the noise variation and incorporate this into the SNR. Once you determine final SNR, you can begin to create the correct communication link conditions.
Following the above will ensure you create the most robust communication link.
